U.S. States and Cities With the Most Self-Employed Workers
Published on: 10/13/2022
The U.S. job market has experienced some of the most volatile times in recent memory.
The onset of the COVID-19 pandemic forced many businesses across the country to close their doors and lay off employees, which brought about an unprecedented spike in unemployment. As economies reopened for business, unemployed workers faced a difficult job market and some turned to self-employment. Due in large part to necessity, recessions often see an increase in self-employment and entrepreneurship.
Self-employment can also be a more attractive option for those looking for flexibility with when and where they work. After nationwide employment rebounded, the job market dramatically shifted in the employee’s favor and portended the Great Resignation—the mass job-quitting phenomenon that began in the spring of 2021, where many workers left their employers for better opportunities and more flexible working conditions. Self-employment presented itself as a potential solution for many that were facing low pay, lack of opportunities for advancement, or even the lack of adequate child care.
The COVID-19 pandemic steered many workers to seek new opportunities, causing self-employment and entrepreneurship to expand and new business applications to reach record levels.

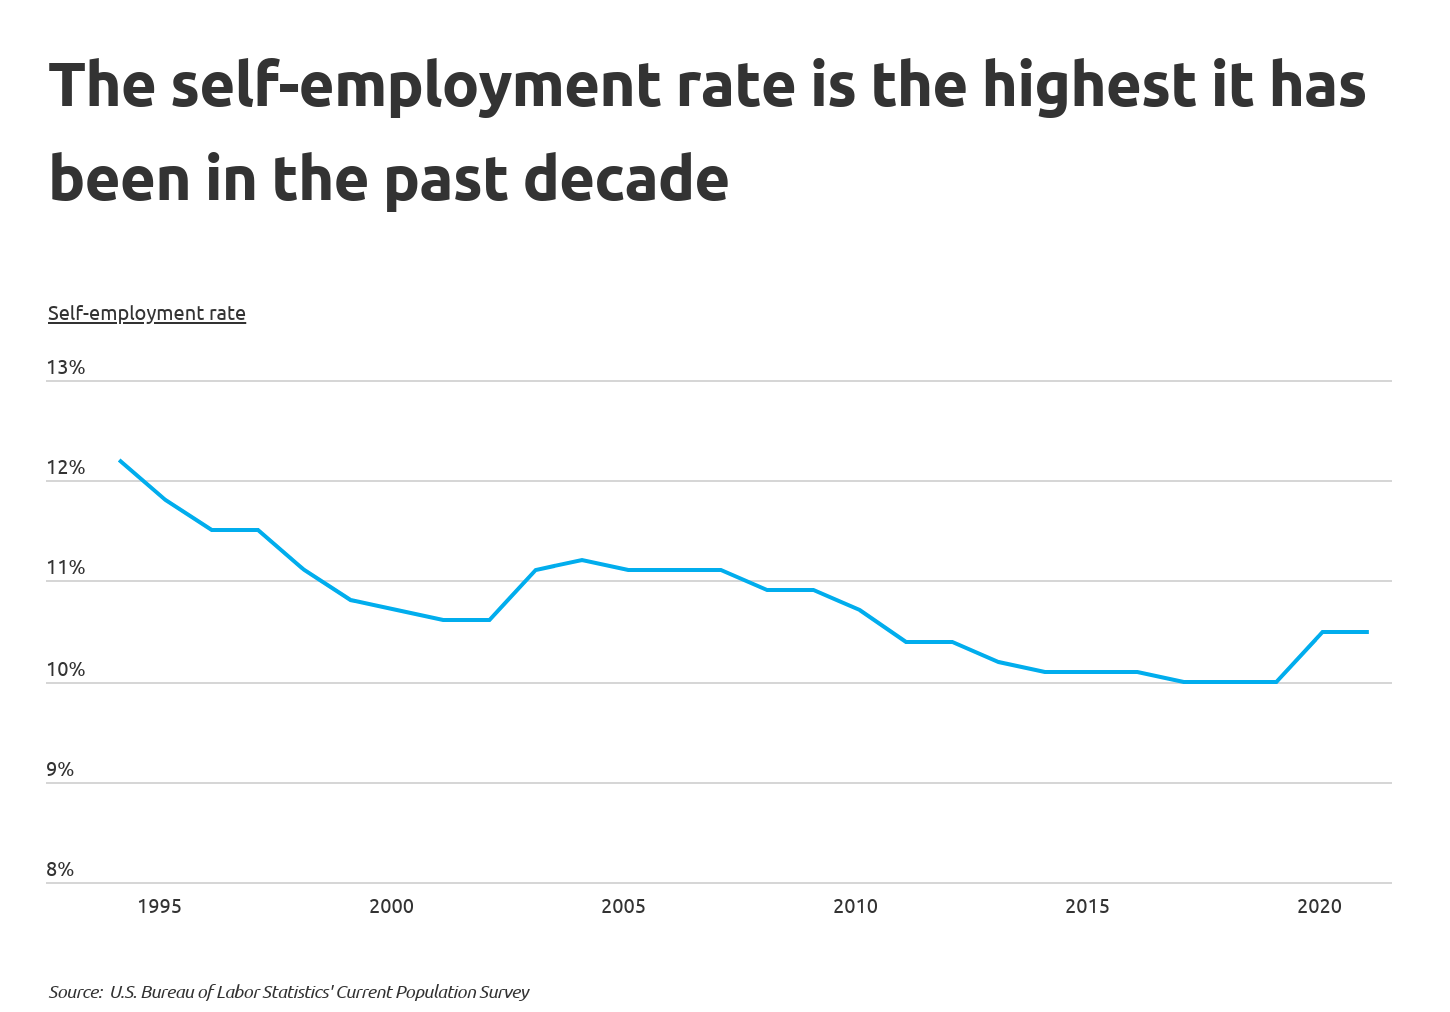
Prior to the pandemic, self-employment was on the decline and had been falling since 2004. When the economic shutdown occurred in the spring of 2020, nearly 22 million workers lost their jobs and the self-employment rate rose to 10.5%. The following year, workers began quitting their jobs at the highest rates since the Great Recession, and consequently, the self-employment rate held steady as some of those workers sought to start businesses.

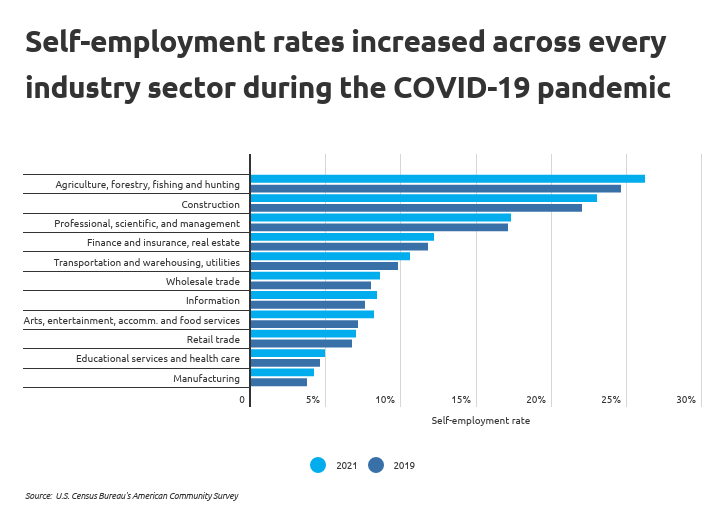
While some industries and occupations have much higher rates of self-employment, all industry sectors saw increases in their self-employment rates when compared to pre-pandemic levels. Manufacturing has the smallest self-employment rate, but saw the largest increase in total self-employed workers at 13.3%. Similarly, the finance industry—which broadly includes insurance and real estate—saw a 7.0% increase in the total number of self-employed workers, likely in part due to the housing boom and subsequent growth in real estate agents.
TRENDING
Most people know you need good credit for obvious reasons like getting a credit card, car loan, or mortgage. But credit can play a role in less obvious things like renting a car or getting approved for a cell phone contract. But can you be denied a job because of bad credit?

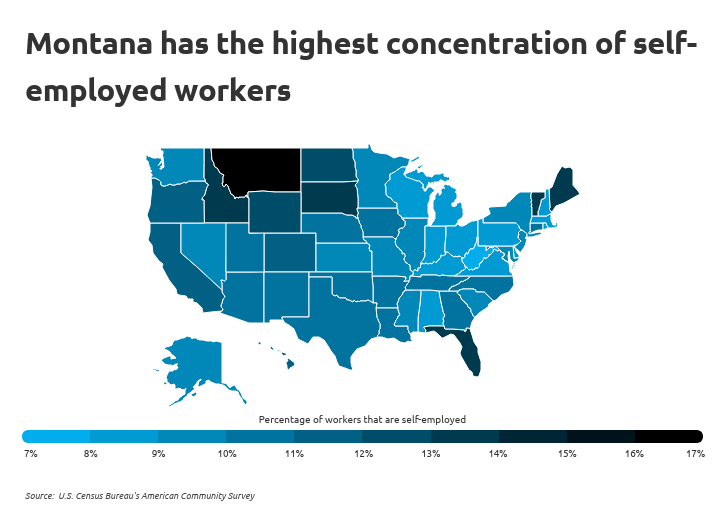
These industry differences in self-employment also create regional differences. Montana heavily relies on agriculture and forestry—which has the highest self-employment rate of all industries—and has the largest concentration of self-employed workers in the country at 16.2%. Meanwhile, Florida (13.1%) has a comparatively low level of employment in industries with high self-employment rates, but its combination of low corporate and individual income taxes along with helpful incentives and resources for businesses makes it an attractive location for entrepreneurs.
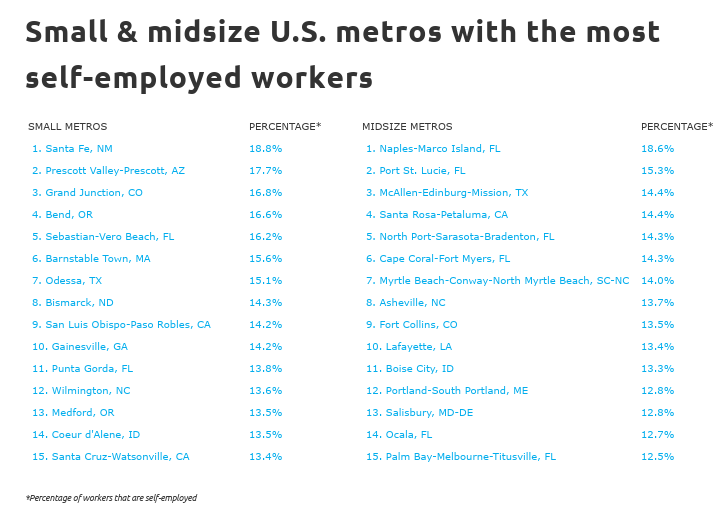
To find the metropolitan areas with the most self-employed workers, researchers on behalf of Self Financial analyzed the latest data from the U.S. Census Bureau. The researchers ranked metro areas according to the percentage of workers that are self-employed. Researchers also calculated the total number of self-employed workers, median income for full-time self-employed workers, and the median income for all full-time workers.
Here are the U.S. metropolitan areas with the most self-employed workers.

LEARN MORE
Building a strong credit profile is like losing weight—you can't just flip a switch to make it better. Here are some things to know about how long it takes to improve your credit score.
DID YOU KNOW?
A credit builder loan is an installment loan that exists for the sole purpose of helping you build positive credit history. Here’s everything you need to know about credit builder loans.
To improve relevance, only metropolitan areas with at least 100,000 people were included in the analysis. Additionally, metro areas were grouped into the following cohorts based on population size:
The onset of the COVID-19 pandemic forced many businesses across the country to close their doors and lay off employees, which brought about an unprecedented spike in unemployment. As economies reopened for business, unemployed workers faced a difficult job market and some turned to self-employment. Due in large part to necessity, recessions often see an increase in self-employment and entrepreneurship.
Self-employment can also be a more attractive option for those looking for flexibility with when and where they work. After nationwide employment rebounded, the job market dramatically shifted in the employee’s favor and portended the Great Resignation—the mass job-quitting phenomenon that began in the spring of 2021, where many workers left their employers for better opportunities and more flexible working conditions. Self-employment presented itself as a potential solution for many that were facing low pay, lack of opportunities for advancement, or even the lack of adequate child care.
The COVID-19 pandemic steered many workers to seek new opportunities, causing self-employment and entrepreneurship to expand and new business applications to reach record levels.

Prior to the pandemic, self-employment was on the decline and had been falling since 2004. When the economic shutdown occurred in the spring of 2020, nearly 22 million workers lost their jobs and the self-employment rate rose to 10.5%. The following year, workers began quitting their jobs at the highest rates since the Great Recession, and consequently, the self-employment rate held steady as some of those workers sought to start businesses.

While some industries and occupations have much higher rates of self-employment, all industry sectors saw increases in their self-employment rates when compared to pre-pandemic levels. Manufacturing has the smallest self-employment rate, but saw the largest increase in total self-employed workers at 13.3%. Similarly, the finance industry—which broadly includes insurance and real estate—saw a 7.0% increase in the total number of self-employed workers, likely in part due to the housing boom and subsequent growth in real estate agents.
TRENDING
Most people know you need good credit for obvious reasons like getting a credit card, car loan, or mortgage. But credit can play a role in less obvious things like renting a car or getting approved for a cell phone contract. But can you be denied a job because of bad credit?

These industry differences in self-employment also create regional differences. Montana heavily relies on agriculture and forestry—which has the highest self-employment rate of all industries—and has the largest concentration of self-employed workers in the country at 16.2%. Meanwhile, Florida (13.1%) has a comparatively low level of employment in industries with high self-employment rates, but its combination of low corporate and individual income taxes along with helpful incentives and resources for businesses makes it an attractive location for entrepreneurs.
To find the metropolitan areas with the most self-employed workers, researchers on behalf of Self Financial analyzed the latest data from the U.S. Census Bureau. The researchers ranked metro areas according to the percentage of workers that are self-employed. Researchers also calculated the total number of self-employed workers, median income for full-time self-employed workers, and the median income for all full-time workers.
Here are the U.S. metropolitan areas with the most self-employed workers.

Large U.S. Metros With the Most Self-Employed Workers
15. Houston-The Woodlands-Sugar Land, TX
- Percentage of workers that are self-employed: 10.4%
- Total self-employed workers: 350,713
- Median income for full-time self-employed workers: $50,000
- Median income for all full-time workers: $50,000
- Population: 7,206,841
LEARN MORE
Building a strong credit profile is like losing weight—you can't just flip a switch to make it better. Here are some things to know about how long it takes to improve your credit score.
14. San Antonio-New Braunfels, TX
- Percentage of workers that are self-employed: 10.5%
- Total self-employed workers: 126,262
- Median income for full-time self-employed workers: $45,000
- Median income for all full-time workers: $45,000
- Population: 2,601,788
13. Oklahoma City, OK
- Percentage of workers that are self-employed: 10.6%
- Total self-employed workers: 72,666
- Median income for full-time self-employed workers: $40,000
- Median income for all full-time workers: $45,000
- Population: 1,441,647
12. Atlanta-Sandy Springs-Alpharetta, GA
- Percentage of workers that are self-employed: 10.6%
- Total self-employed workers: 323,989
- Median income for full-time self-employed workers: $50,000
- Median income for all full-time workers: $54,000
- Population: 6,144,050
11. Portland-Vancouver-Hillsboro, OR-WA
- Percentage of workers that are self-employed: 10.9%
- Total self-employed workers: 137,893
- Median income for full-time self-employed workers: $59,000
- Median income for all full-time workers: $60,000
- Population: 2,511,612
10. Denver-Aurora-Lakewood, CO
- Percentage of workers that are self-employed: 10.9%
- Total self-employed workers: 177,204
- Median income for full-time self-employed workers: $62,000
- Median income for all full-time workers: $60,000
- Population: 2,972,566
9. San Francisco-Oakland-Berkeley, CA
- Percentage of workers that are self-employed: 10.9%
- Total self-employed workers: 256,567
- Median income for full-time self-employed workers: $70,000
- Median income for all full-time workers: $82,000
- Population: 4,623,264
8. New Orleans-Metairie, LA
- Percentage of workers that are self-employed: 11.0%
- Total self-employed workers: 62,112
- Median income for full-time self-employed workers: $48,000
- Median income for all full-time workers: $50,000
- Population: 1,261,726
7. San Diego-Chula Vista-Carlsbad, CA
- Percentage of workers that are self-employed: 11.0%
- Total self-employed workers: 169,080
- Median income for full-time self-employed workers: $52,000
- Median income for all full-time workers: $59,000
- Population: 3,286,069
6. Austin-Round Rock-Georgetown, TX
- Percentage of workers that are self-employed: 11.2%
- Total self-employed workers: 142,711
- Median income for full-time self-employed workers: $60,000
- Median income for all full-time workers: $60,000
- Population: 2,352,426
5. Orlando-Kissimmee-Sanford, FL
- Percentage of workers that are self-employed: 11.2%
- Total self-employed workers: 145,480
- Median income for full-time self-employed workers: $50,000
- Median income for all full-time workers: $45,000
- Population: 2,691,925
4. Tampa-St. Petersburg-Clearwater, FL
- Percentage of workers that are self-employed: 11.5%
- Total self-employed workers: 175,962
- Median income for full-time self-employed workers: $50,000
- Median income for all full-time workers: $48,000
- Population: 3,219,514
3. Nashville-Davidson--Murfreesboro--Franklin, TN
- Percentage of workers that are self-employed: 11.6%
- Total self-employed workers: 120,898
- Median income for full-time self-employed workers: $50,000
- Median income for all full-time workers: $50,000
- Population: 2,012,476
2. Los Angeles-Long Beach-Anaheim, CA
- Percentage of workers that are self-employed: 13.2%
- Total self-employed workers: 820,969
- Median income for full-time self-employed workers: $50,000
- Median income for all full-time workers: $53,000
- Population: 12,997,353
DID YOU KNOW?
A credit builder loan is an installment loan that exists for the sole purpose of helping you build positive credit history. Here’s everything you need to know about credit builder loans.
1. Miami-Fort Lauderdale-Pompano Beach, FL
- Percentage of workers that are self-employed: 15.8%
- Total self-employed workers: 468,070
- Median income for full-time self-employed workers: $40,000
- Median income for all full-time workers: $44,200
- Population: 6,091,747
Detailed Findings & Methodology
To find the metropolitan areas with the most self-employed workers, researchers on behalf of Self Financial analyzed the latest data from the U.S. Census Bureau’s 2021 American Community Survey. The researchers ranked metro areas according to the percentage of workers that are self-employed. In the event of a tie, the metro with the larger number of self-employed workers was ranked higher. Researchers also calculated the median income for full-time self-employed workers and the median income for all full-time workers using data from 2020, the latest available.To improve relevance, only metropolitan areas with at least 100,000 people were included in the analysis. Additionally, metro areas were grouped into the following cohorts based on population size:
- Small metros: 100,000–349,999
- Midsize metros: 350,000–999,999
- Large metros: more than 1,000,000

Written on October 13, 2022
Self is a venture-backed startup that helps people build credit and savings.
Self does not provide financial advice. The content on this page provides general consumer information and is not intended for legal, financial, or regulatory guidance. The content presented does not reflect the view of the Issuing Banks. Although this information may include references to third-party resources or content, Self does not endorse or guarantee the accuracy of this third-party information. Any Self product links are advertisements for Self products. Please consider the date of publishing for Self’s original content and any affiliated content to best understand their contexts.