U.S. Cities Where Residents Earn the Most From Alternative Income Streams
Published on: 06/29/2022
Heightened inflation over the last year is stretching many households’ finances. The U.S. Bureau of Labor Statistics figures from April 2022 suggested that inflation may have peaked, but showed that prices have increased by 8.3% year-over-year. A dollar does not go as far as it did at the beginning of 2021, and households are doing what they can to keep up with rapid price increases.
In the labor market, workers are taking advantage of a tight labor market to negotiate better terms for compensation and working conditions. Workers in recent months have been quitting in record numbers, a phenomenon that has come to be known as the Great Resignation, and frequently seeking out better-paying positions when they do. And with employers struggling to recruit and retain employees, workers who elect to stay in their current positions have greater leverage to negotiate salary increases or other benefits.
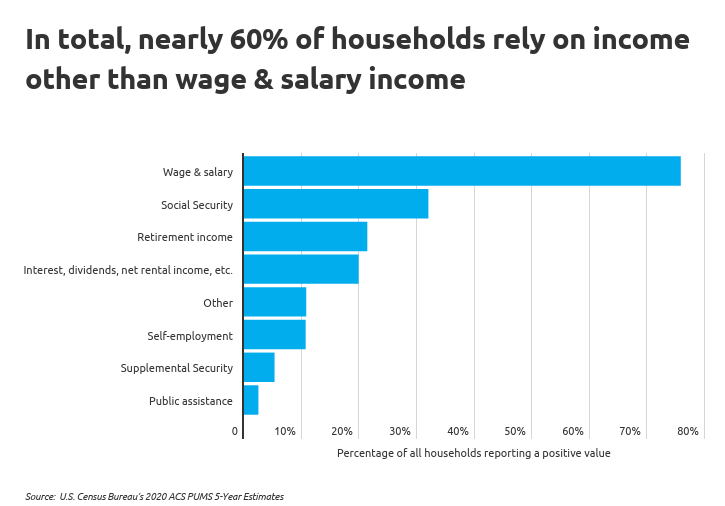
But inflation poses a unique challenge for the nearly 60% of American households that rely on income other than wages and salaries, like social security, stock dividends, self employment, or public assistance. Unlike wages and salaries, these alternative income streams are unlikely to be negotiable. Instead, households with income from such sources may be at the mercy of rapid changes in stock market performance or the slow pace of inflation adjustments for government benefits programs.
According to data from the U.S. Census Bureau, wages and salaries are the most common form of income for Americans. More than 75% of households report receiving wages and salaries. But alternative income streams are common in a large number of households as well. Nearly one in three Americans receive Social Security, 21.4% rely on other forms of retirement income, and 19.9% report income from interest, dividends, and rentals.

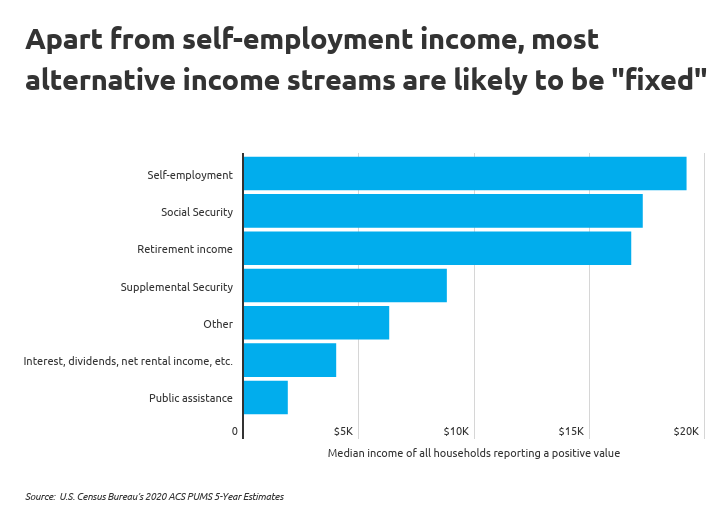
Most alternative income streams are considered to be “fixed,” which means that they pay out a set amount on a regular basis. Social Security, Supplemental Security Income (SSI), and public assistance programs are all government-administered income support for populations in need. While some of these programs do receive an annual inflation adjustment, payments are not adjusted month-to-month, and the annual adjustment may fall short of the overall level of inflation. For example, Social Security and SSI applied a 5.9% cost of living adjustment in 2022—a number that, despite being the largest annual increase in the past 40 years, still lags the current rate of inflation.

Meanwhile, income sources like retirement income from a 401k or interest and dividend payments may yield less of an overall return when the market is underperforming. And because all of these alternative income streams typically provide a lower amount of income per household than wages and salaries, losses to inflation or market underperformance can have adverse effects for people who rely on them to meet basic needs.
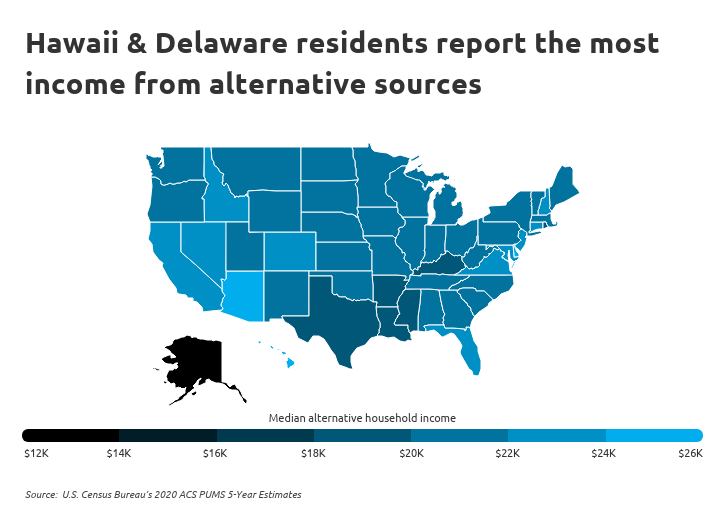
Where people rely on alternative income and how much they earn depends on demographic and economic factors unique to each state. For example, Arizona and Florida are major destinations for retirees, who are more likely to rely on Social Security and retirement income, and they respectively rank third and fifth for median household alternative incomes. Connecticut historically had the highest rate of stock market participation in the U.S., so its residents may be more likely to collect interest, dividends, and other investment income. But the top two states for alternative incomes are Hawaii and Delaware, which stand out as the only two states with median household alternative income above $25,000.


RELATED
Can you be denied a job because of bad credit? Employers have the right to review your credit profile as part of the hiring process. If your credit score isn’t where you want it, check out Self Financial’s guide on how to build credit.
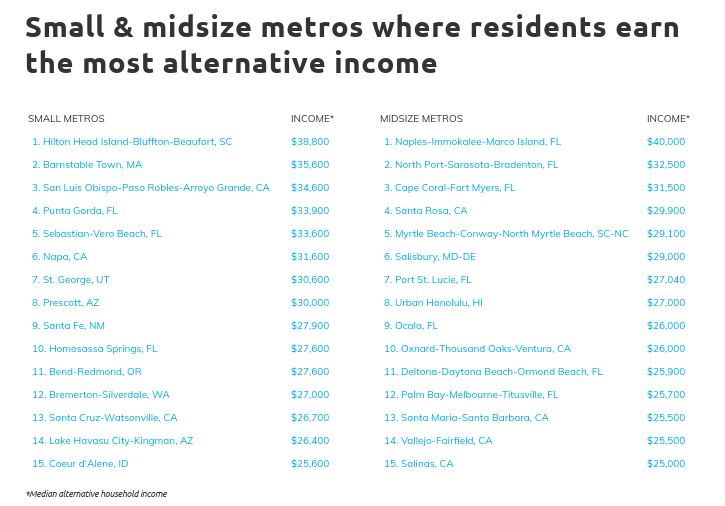
The data used in this analysis is from the U.S. Census Bureau’s 2020 ACS PUMS 5-Year Estimates. To determine the locations where residents earn the most from alternative income streams, researchers at Self Financial calculated the median alternative household income among households with positive alternative income. In the event of a tie, the location with the greater percentage of households with alternative income was ranked higher. Alternative income for the purpose of this analysis is defined as any income not earned as wages or salary. To improve relevance, only metropolitan areas with at least 100,000 residents were included. Additionally, metros were grouped into cohorts based on population size: small (100,000–349,999), midsize (350,000–999,999), and large (1,000,000 or more).
Here are the U.S. metropolitan areas where residents earn the most from alternative income streams.
TRENDING
Is your credit score lower than you’d like? Using a secured credit card—a credit card that uses a security deposit as collateral—can be an excellent way to build credit.
LEARN MORE
The unknown and varying amount of time it takes to establish or improve your credit can be frustrating, especially if you’re trying to decide whether it’s worth the effort in the first place. Here’s what you need to know about how long it takes to build credit.
In the labor market, workers are taking advantage of a tight labor market to negotiate better terms for compensation and working conditions. Workers in recent months have been quitting in record numbers, a phenomenon that has come to be known as the Great Resignation, and frequently seeking out better-paying positions when they do. And with employers struggling to recruit and retain employees, workers who elect to stay in their current positions have greater leverage to negotiate salary increases or other benefits.
But inflation poses a unique challenge for the nearly 60% of American households that rely on income other than wages and salaries, like social security, stock dividends, self employment, or public assistance. Unlike wages and salaries, these alternative income streams are unlikely to be negotiable. Instead, households with income from such sources may be at the mercy of rapid changes in stock market performance or the slow pace of inflation adjustments for government benefits programs.
According to data from the U.S. Census Bureau, wages and salaries are the most common form of income for Americans. More than 75% of households report receiving wages and salaries. But alternative income streams are common in a large number of households as well. Nearly one in three Americans receive Social Security, 21.4% rely on other forms of retirement income, and 19.9% report income from interest, dividends, and rentals.

Most alternative income streams are considered to be “fixed,” which means that they pay out a set amount on a regular basis. Social Security, Supplemental Security Income (SSI), and public assistance programs are all government-administered income support for populations in need. While some of these programs do receive an annual inflation adjustment, payments are not adjusted month-to-month, and the annual adjustment may fall short of the overall level of inflation. For example, Social Security and SSI applied a 5.9% cost of living adjustment in 2022—a number that, despite being the largest annual increase in the past 40 years, still lags the current rate of inflation.

Meanwhile, income sources like retirement income from a 401k or interest and dividend payments may yield less of an overall return when the market is underperforming. And because all of these alternative income streams typically provide a lower amount of income per household than wages and salaries, losses to inflation or market underperformance can have adverse effects for people who rely on them to meet basic needs.
Where people rely on alternative income and how much they earn depends on demographic and economic factors unique to each state. For example, Arizona and Florida are major destinations for retirees, who are more likely to rely on Social Security and retirement income, and they respectively rank third and fifth for median household alternative incomes. Connecticut historically had the highest rate of stock market participation in the U.S., so its residents may be more likely to collect interest, dividends, and other investment income. But the top two states for alternative incomes are Hawaii and Delaware, which stand out as the only two states with median household alternative income above $25,000.


RELATED
Can you be denied a job because of bad credit? Employers have the right to review your credit profile as part of the hiring process. If your credit score isn’t where you want it, check out Self Financial’s guide on how to build credit.
The data used in this analysis is from the U.S. Census Bureau’s 2020 ACS PUMS 5-Year Estimates. To determine the locations where residents earn the most from alternative income streams, researchers at Self Financial calculated the median alternative household income among households with positive alternative income. In the event of a tie, the location with the greater percentage of households with alternative income was ranked higher. Alternative income for the purpose of this analysis is defined as any income not earned as wages or salary. To improve relevance, only metropolitan areas with at least 100,000 residents were included. Additionally, metros were grouped into cohorts based on population size: small (100,000–349,999), midsize (350,000–999,999), and large (1,000,000 or more).
Here are the U.S. metropolitan areas where residents earn the most from alternative income streams.
Large Metros Where Residents Earn the Most Alternative Income
15. Jacksonville, FL
- Median alternative household income: $21,600
- Median household total income: $61,000
- Percentage of households with alternative income: 58.0%
TRENDING
Is your credit score lower than you’d like? Using a secured credit card—a credit card that uses a security deposit as collateral—can be an excellent way to build credit.
14. Las Vegas-Henderson-Paradise, NV
- Median alternative household income: $21,700
- Median household total income: $60,000
- Percentage of households with alternative income: 55.8%
13. Riverside-San Bernardino-Ontario, CA
- Median alternative household income: $21,800
- Median household total income: $65,900
- Percentage of households with alternative income: 58.2%
12. Richmond, VA
- Median alternative household income: $21,900
- Median household total income: $68,500
- Percentage of households with alternative income: 59.2%
11. Denver-Aurora-Lakewood, CO
- Median alternative household income: $22,000
- Median household total income: $80,000
- Percentage of households with alternative income: 55.5%
10. Baltimore-Columbia-Towson, MD
- Median alternative household income: $22,000
- Median household total income: $80,340
- Percentage of households with alternative income: 58.9%
9. Tampa-St. Petersburg-Clearwater, FL
- Median alternative household income: $22,400
- Median household total income: $55,100
- Percentage of households with alternative income: 60.5%
8. Virginia Beach-Norfolk-Newport News, VA-NC
- Median alternative household income: $22,600
- Median household total income: $65,840
- Percentage of households with alternative income: 58.8%
7. Washington-Arlington-Alexandria, DC-VA-MD-WV
- Median alternative household income: $22,700
- Median household total income: $102,700
- Percentage of households with alternative income: 57.5%
6. Hartford-West Hartford-East Hartford, CT
- Median alternative household income: $23,200
- Median household total income: $75,800
- Percentage of households with alternative income: 60.8%
5. San Francisco-Oakland-Hayward, CA
- Median alternative household income: $23,700
- Median household total income: $107,380
- Percentage of households with alternative income: 64.3%
LEARN MORE
The unknown and varying amount of time it takes to establish or improve your credit can be frustrating, especially if you’re trying to decide whether it’s worth the effort in the first place. Here’s what you need to know about how long it takes to build credit.
4. Tucson, AZ
- Median alternative household income: $23,800
- Median household total income: $54,000
- Percentage of households with alternative income: 63.0%
3. San Diego-Carlsbad, CA
- Median alternative household income: $24,000
- Median household total income: $80,000
- Percentage of households with alternative income: 60.6%
2. Sacramento--Roseville--Arden-Arcade, CA
- Median alternative household income: $24,300
- Median household total income: $73,800
- Percentage of households with alternative income: 61.3%
1. Phoenix-Mesa-Scottsdale, AZ
- Median alternative household income: $24,400
- Median household total income: $65,300
- Percentage of households with alternative income: 56.4%
Detailed Findings & Methodology
The data used in this analysis is from the U.S. Census Bureau’s 2020 ACS PUMS 5-Year Estimates. To determine the locations where residents earn the most from alternative income streams, researchers calculated the median alternative household income among households with positive alternative income. In the event of a tie, the location with the greater percentage of households with alternative income was ranked higher. All median field measures were calculated among households with positive values for that field. Alternative income for the purpose of this analysis is defined as any income not earned as wages or salary. To improve relevance, only metropolitan areas with at least 100,000 residents were included. Additionally, metros were grouped into cohorts based on population size: small (100,000–349,999), midsize (350,000–999,999), and large (1,000,000 or more).
Written on June 29, 2022
Self is a venture-backed startup that helps people build credit and savings.
Self does not provide financial advice. The content on this page provides general consumer information and is not intended for legal, financial, or regulatory guidance. The content presented does not reflect the view of the Issuing Banks. Although this information may include references to third-party resources or content, Self does not endorse or guarantee the accuracy of this third-party information. Any Self product links are advertisements for Self products. Please consider the date of publishing for Self’s original content and any affiliated content to best understand their contexts.